
Dashboard Overview
The Dashboard is the first thing you see after activation. It gives you a live snapshot of your lazy loading setup and LQIP generation status - no digging through settings required.
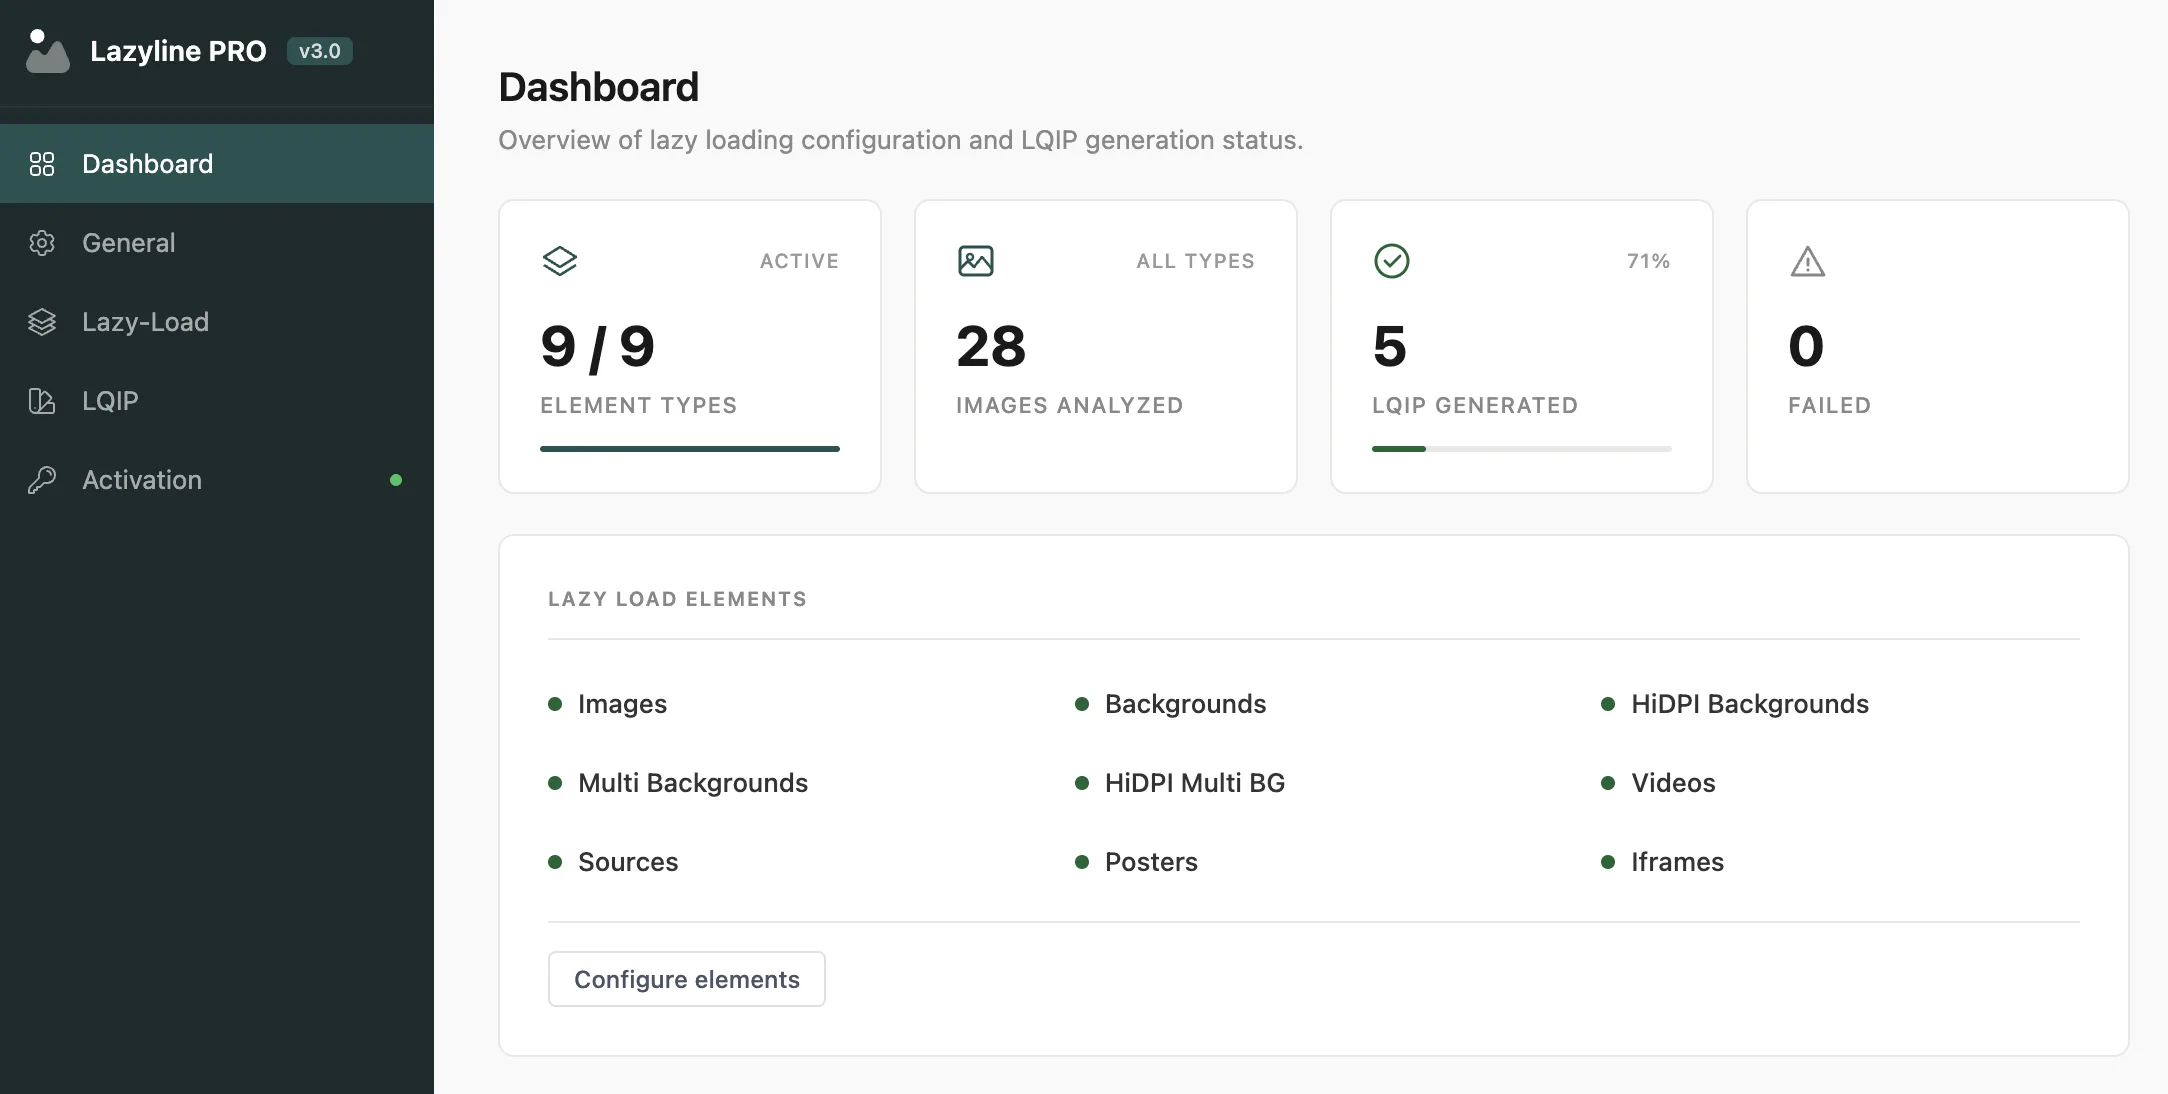
#Stat Cards
Four summary cards at the top of the page:
Card | What it shows |
|---|---|
Element Types | Active lazy load element types out of 9 total, with a progress bar |
Images Analyzed | Total images scanned across all LQIP types |
LQIP Generated | Number of placeholders created, with completion percentage |
Failed | Images that couldn't be processed during generation |
If the Failed count is non-zero, head to LQIP Settings > Batch Generation to see which images failed. Common causes: unsupported format, missing file, or memory limit.
#Lazy Load Elements
A grid showing which of the 9 element types are currently enabled (green dot) or disabled (gray dot). Click Configure elements to jump directly to the Lazy Load settings page.
#LQIP Generation Table
A per-type breakdown of LQIP generation status across all four methods:
Progress - visual progress bar with percentage complete
Generated / Failed / Pending - exact counts for each state
Status - one of: Complete, In progress, Has errors, Not analyzed, or Not generated
The currently active type is highlighted with a pill badge
You can generate LQIP data for all four types and switch between them freely. Only the active type is shown to visitors.
#Configuration Summary
Key settings shown at a glance so you don't have to open each settings page:
Plugin version and license status
Active LQIP mode
Viewport threshold
Native lazy loading on/off
Preloader type
Dev mode status
Last updated
Was this article helpful?

On this page