
Dashboard Overview
The Dashboard is the first page you see after activation. It gives you a quick overview of your optimization status across all categories - a great place to get oriented before diving into settings.
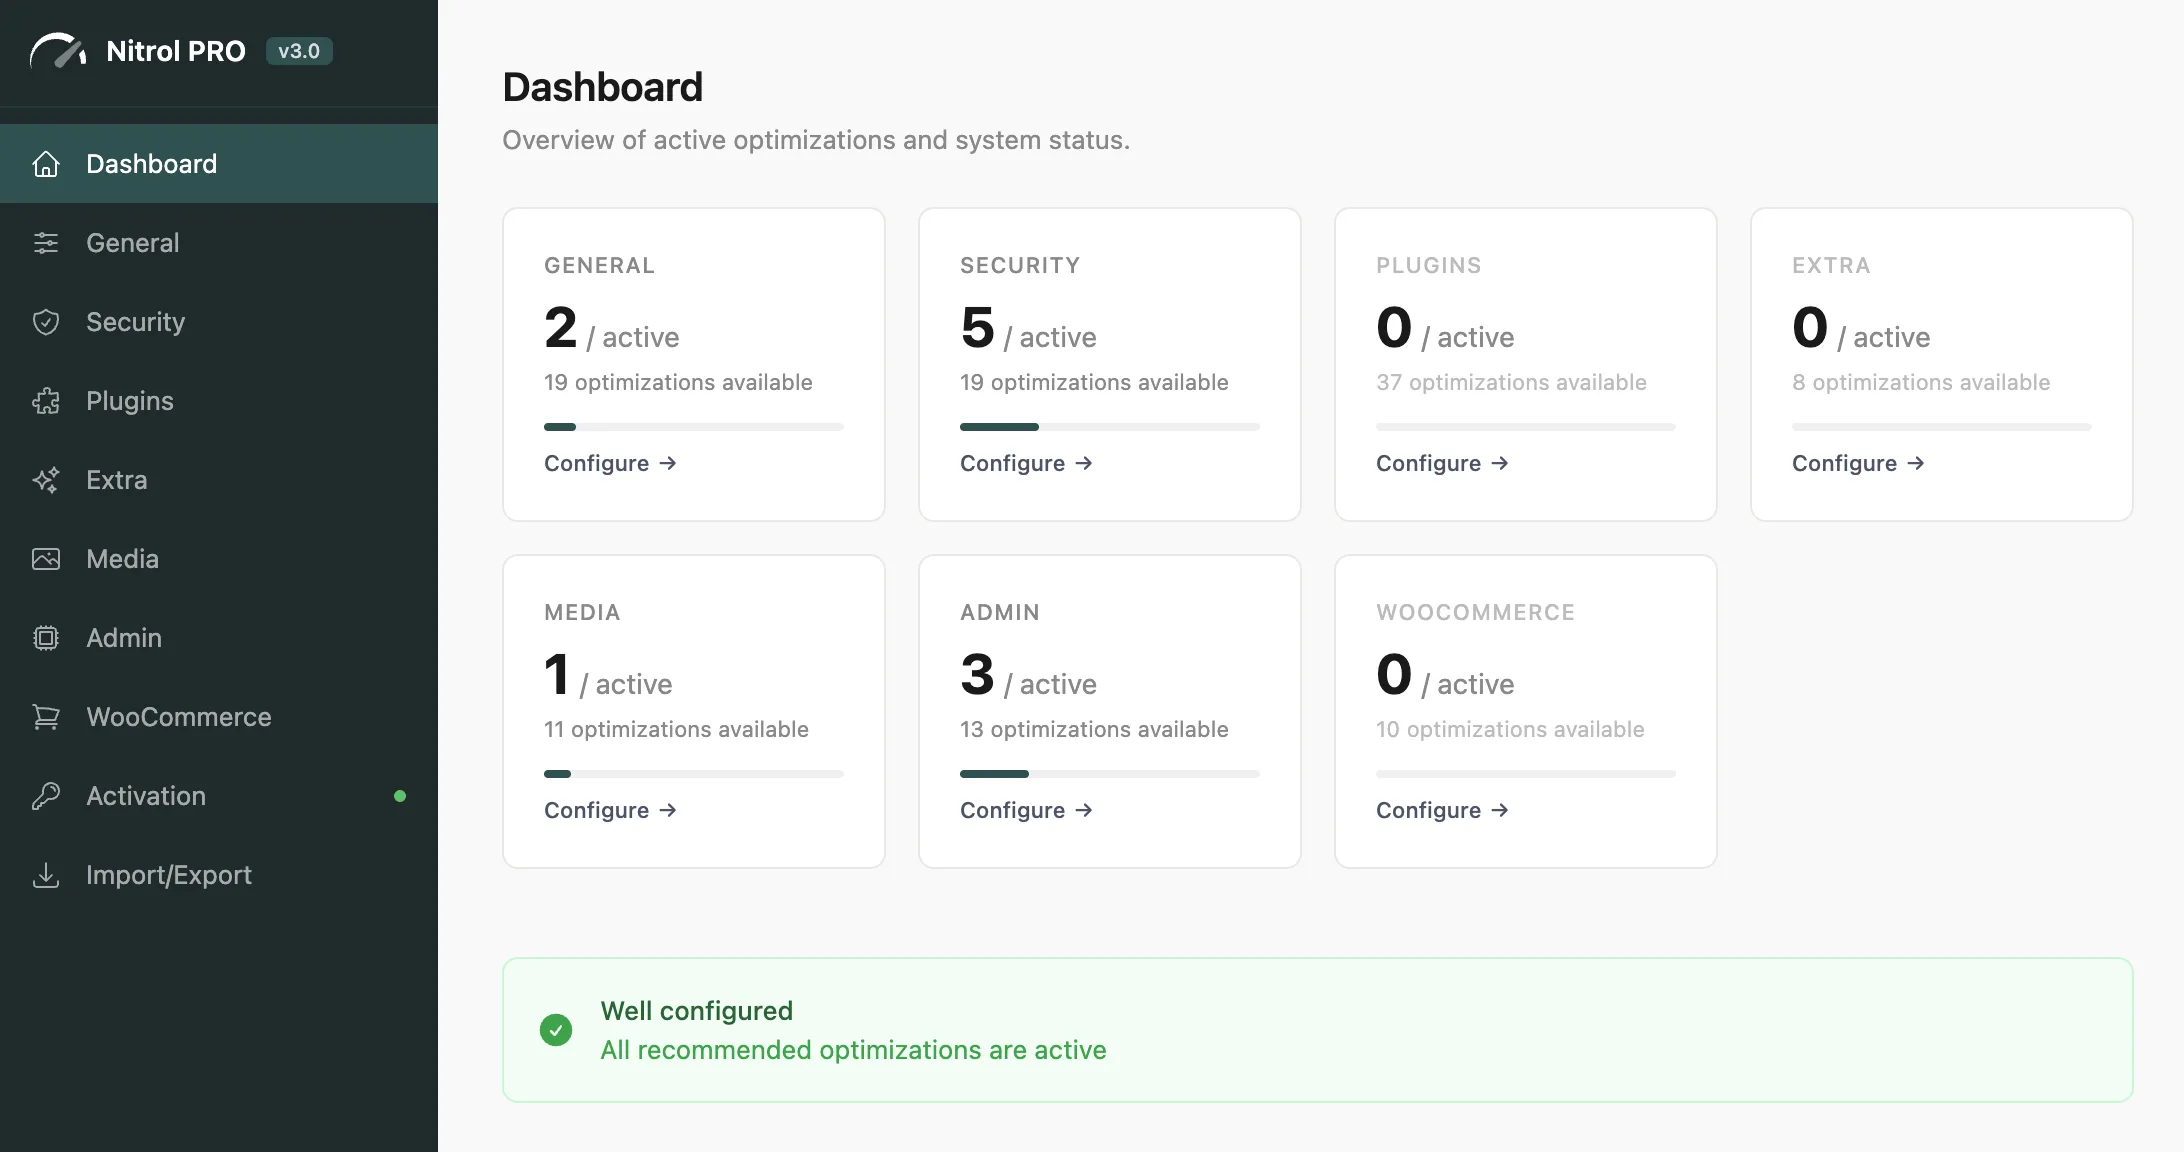
#Stat Cards
Seven cards show how many settings are currently active versus the total available in each category:
General - core WordPress cleanup (23 settings)
Security - hardening toggles (21 settings)
Plugins - third-party asset optimization (38 settings)
Media - upload and image controls (12 settings)
Admin - dashboard customization (13 settings)
WooCommerce - store optimization (12 settings)
Extra - miscellaneous utilities (8 settings)
Click Configure on any card to jump directly to that settings page.
#Quick Start
A curated set of recommended optimizations you can enable with one click. These are safe for most sites and provide immediate performance benefits - no configuration required.
If you're new to Nitrol PRO, the Quick Start panel is the best place to begin. It applies the most impactful settings automatically - you can always fine-tune from there.
#System Information
Shows your current environment at a glance:
Field | What it shows |
|---|---|
Plugin Version | Currently installed Nitrol PRO version |
PHP Version | Server PHP version (8.1+ required) |
WordPress Version | Core WordPress version |
Detected Plugins | Which supported plugins are active (WooCommerce, Elementor, Yoast, etc.) |
The Detected Plugins list determines which cards are active in the Plugins settings section. Only plugins that are currently installed and activated will show available settings.
Last updated
Was this article helpful?

On this page