Analytics
Turn raw execution data into actionable insight. The Analytics addon transforms your cron logs into charts, heatmaps, and rankings so you can spot problems before they become outages.
Analytics requires Execution Tracking to be enabled in Settings > General. The addon will show empty charts until tracking is on and data has been collected.
#Trend Analysis
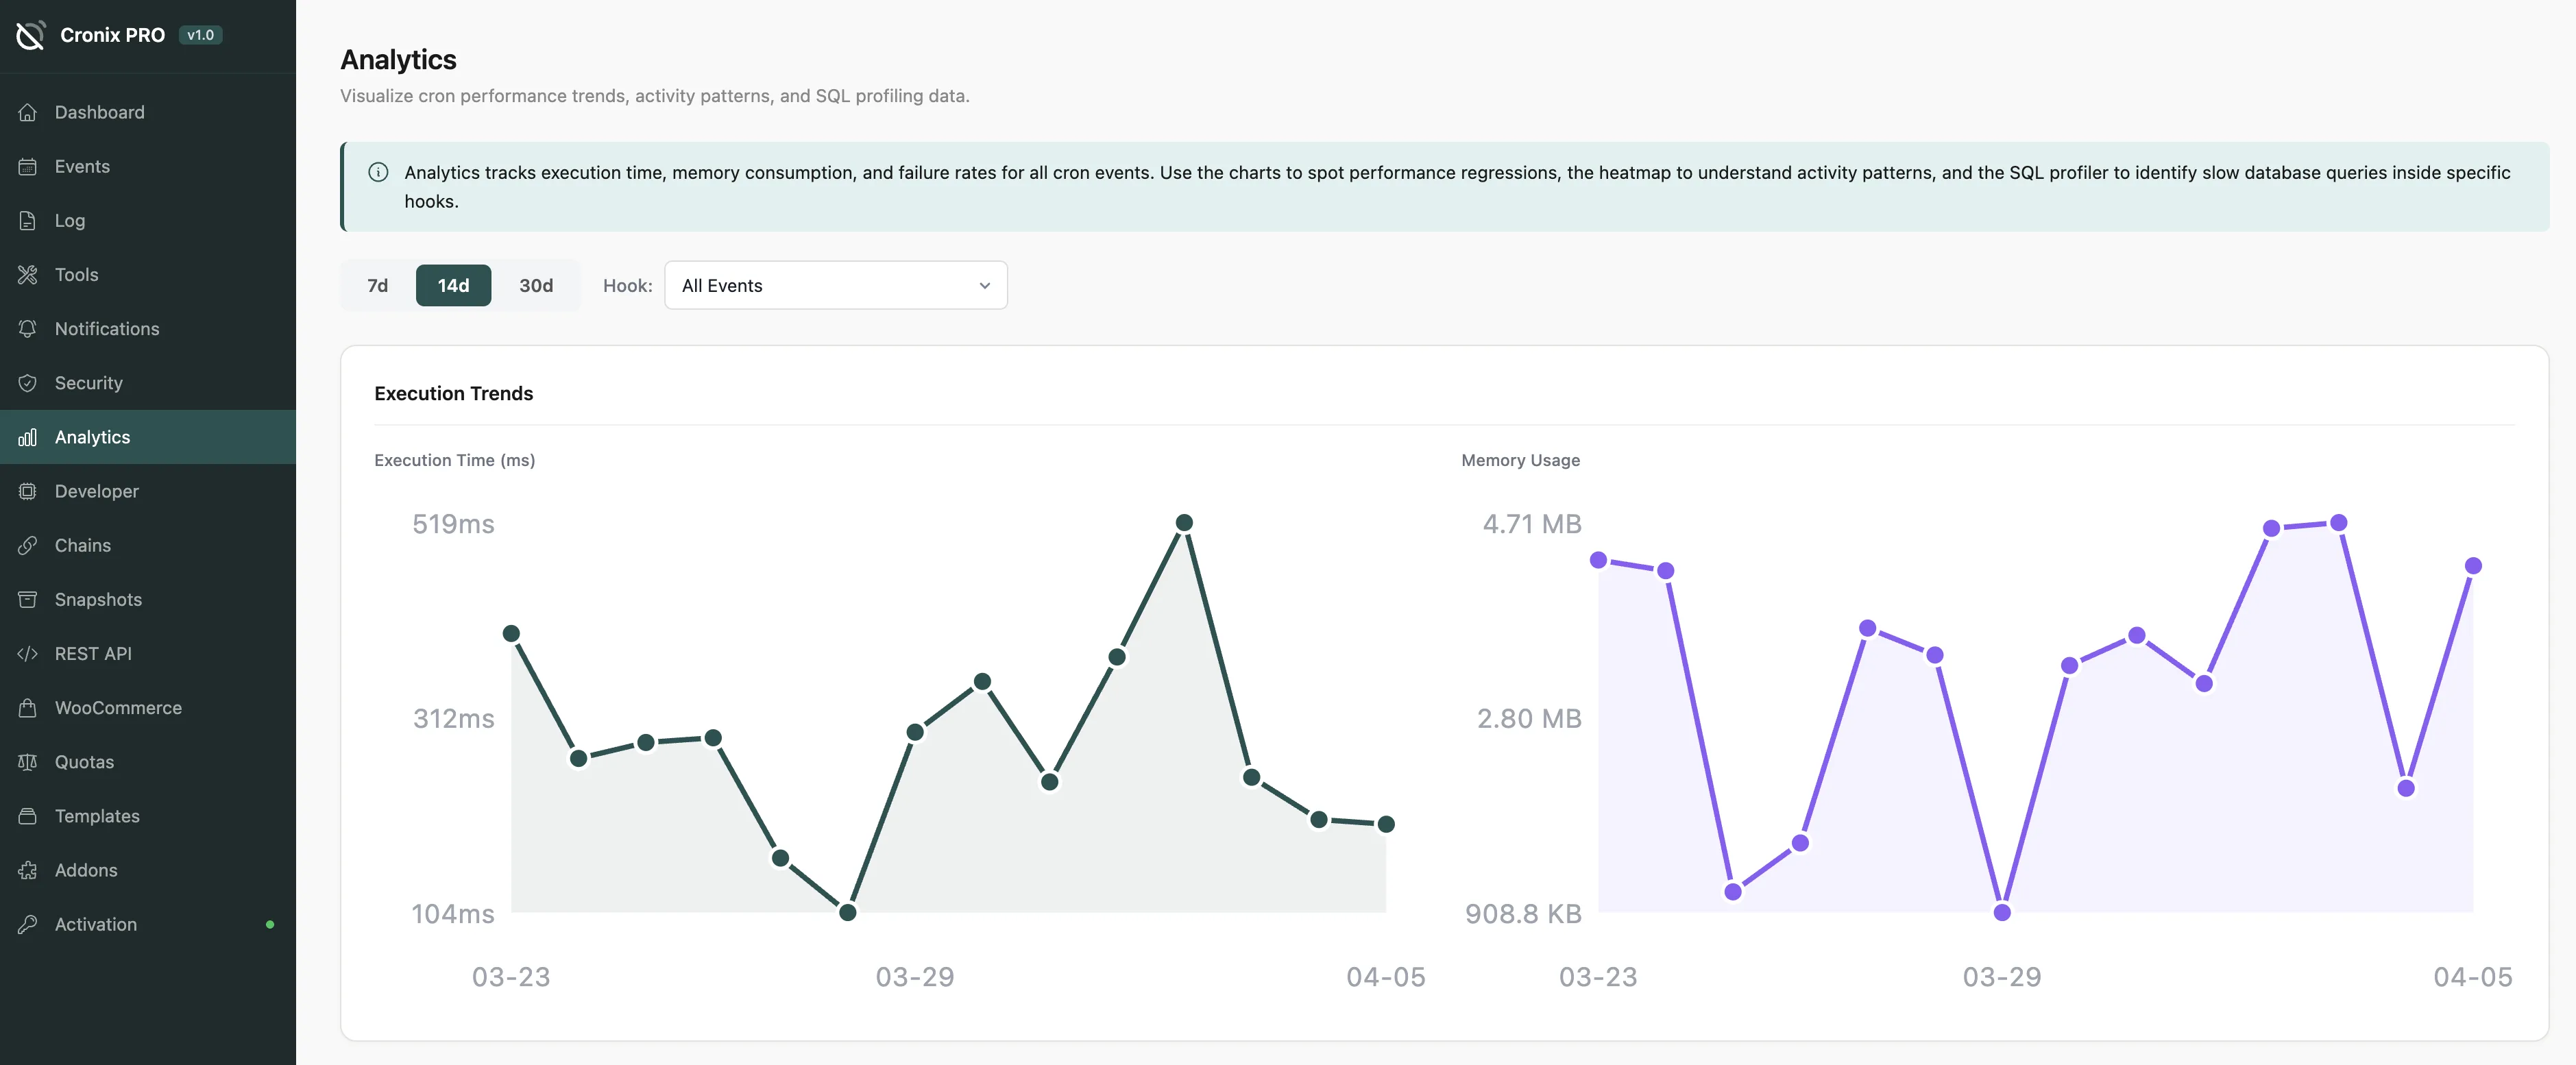
Line charts showing execution time and memory usage over 7, 14, or 30 days. Each line represents one hook.
Use the trend charts to:
Spot hooks that are getting slower over time
Detect regressions after plugin updates or server changes
Confirm that a fix actually improved performance
Compare the 7-day and 30-day views side by side to see whether a performance issue is new or has been building gradually.
#Heatmap
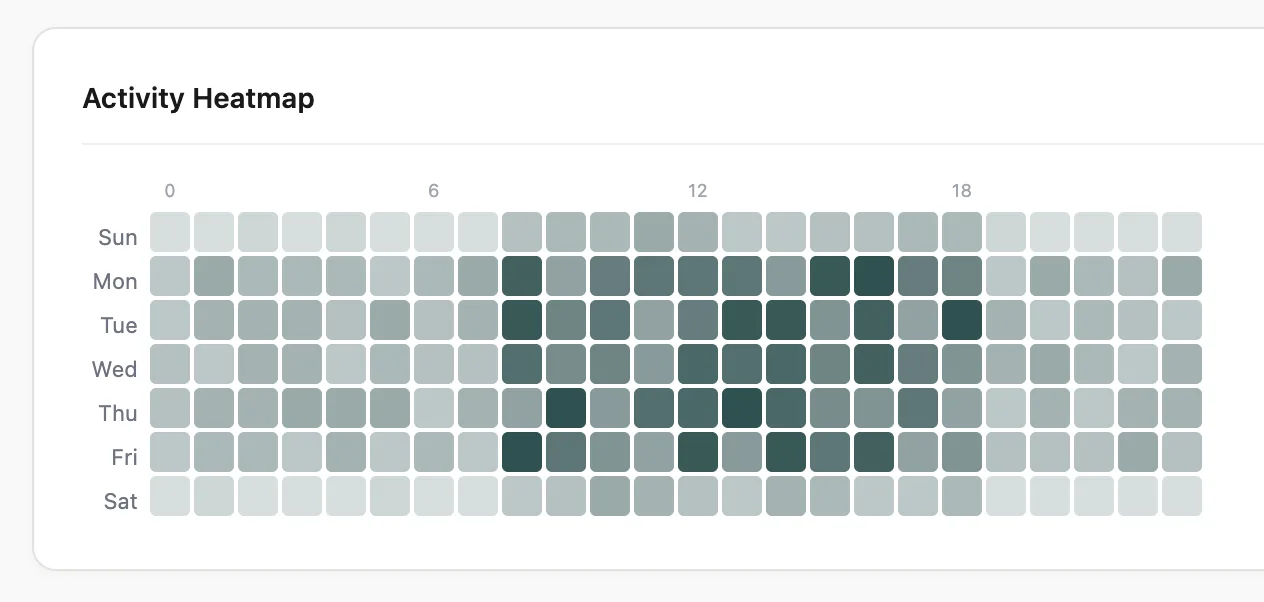
A grid showing when events are most likely to fail or run slowly. Rows are hours of the day, columns are days of the week. Darker cells mean more issues in that time slot.
The heatmap reveals patterns that are invisible in a log table - for example, a hook that reliably fails every Monday morning when the weekly backup runs.
#Top-Heavy Rankings
Which hooks are consuming the most resources? Sorted by:
Total execution time - cumulative CPU time over the selected period
Peak memory usage - highest single-execution memory recorded
Number of runs - most frequently executed hooks
This ranking is the fastest way to identify optimization candidates.
#Query Profiler
Tracks the number of database queries each cron event generates. Hooks that run excessive SQL queries can cause table lock contention and slow down the entire site.
A hook with hundreds of queries per execution is a strong signal of an N+1 query problem or missing cache. Use the Developer Tools addon to inspect the callback code.
#Predictive Analyzer
Looks at historical failure patterns and flags hooks that are likely to fail in the next 24 hours, based on time-of-day patterns, error frequency trends, and dependency chains.
#Impact Scoring
Ranks events by how much damage a failure would cause, based on three factors:
Frequency - how often it runs
Duration - how long it takes
Dependencies - whether other hooks depend on it (via Event Chains)
High-impact hooks are the ones worth monitoring most closely.
Last updated
Was this article helpful?

On this page