Visual Timeline
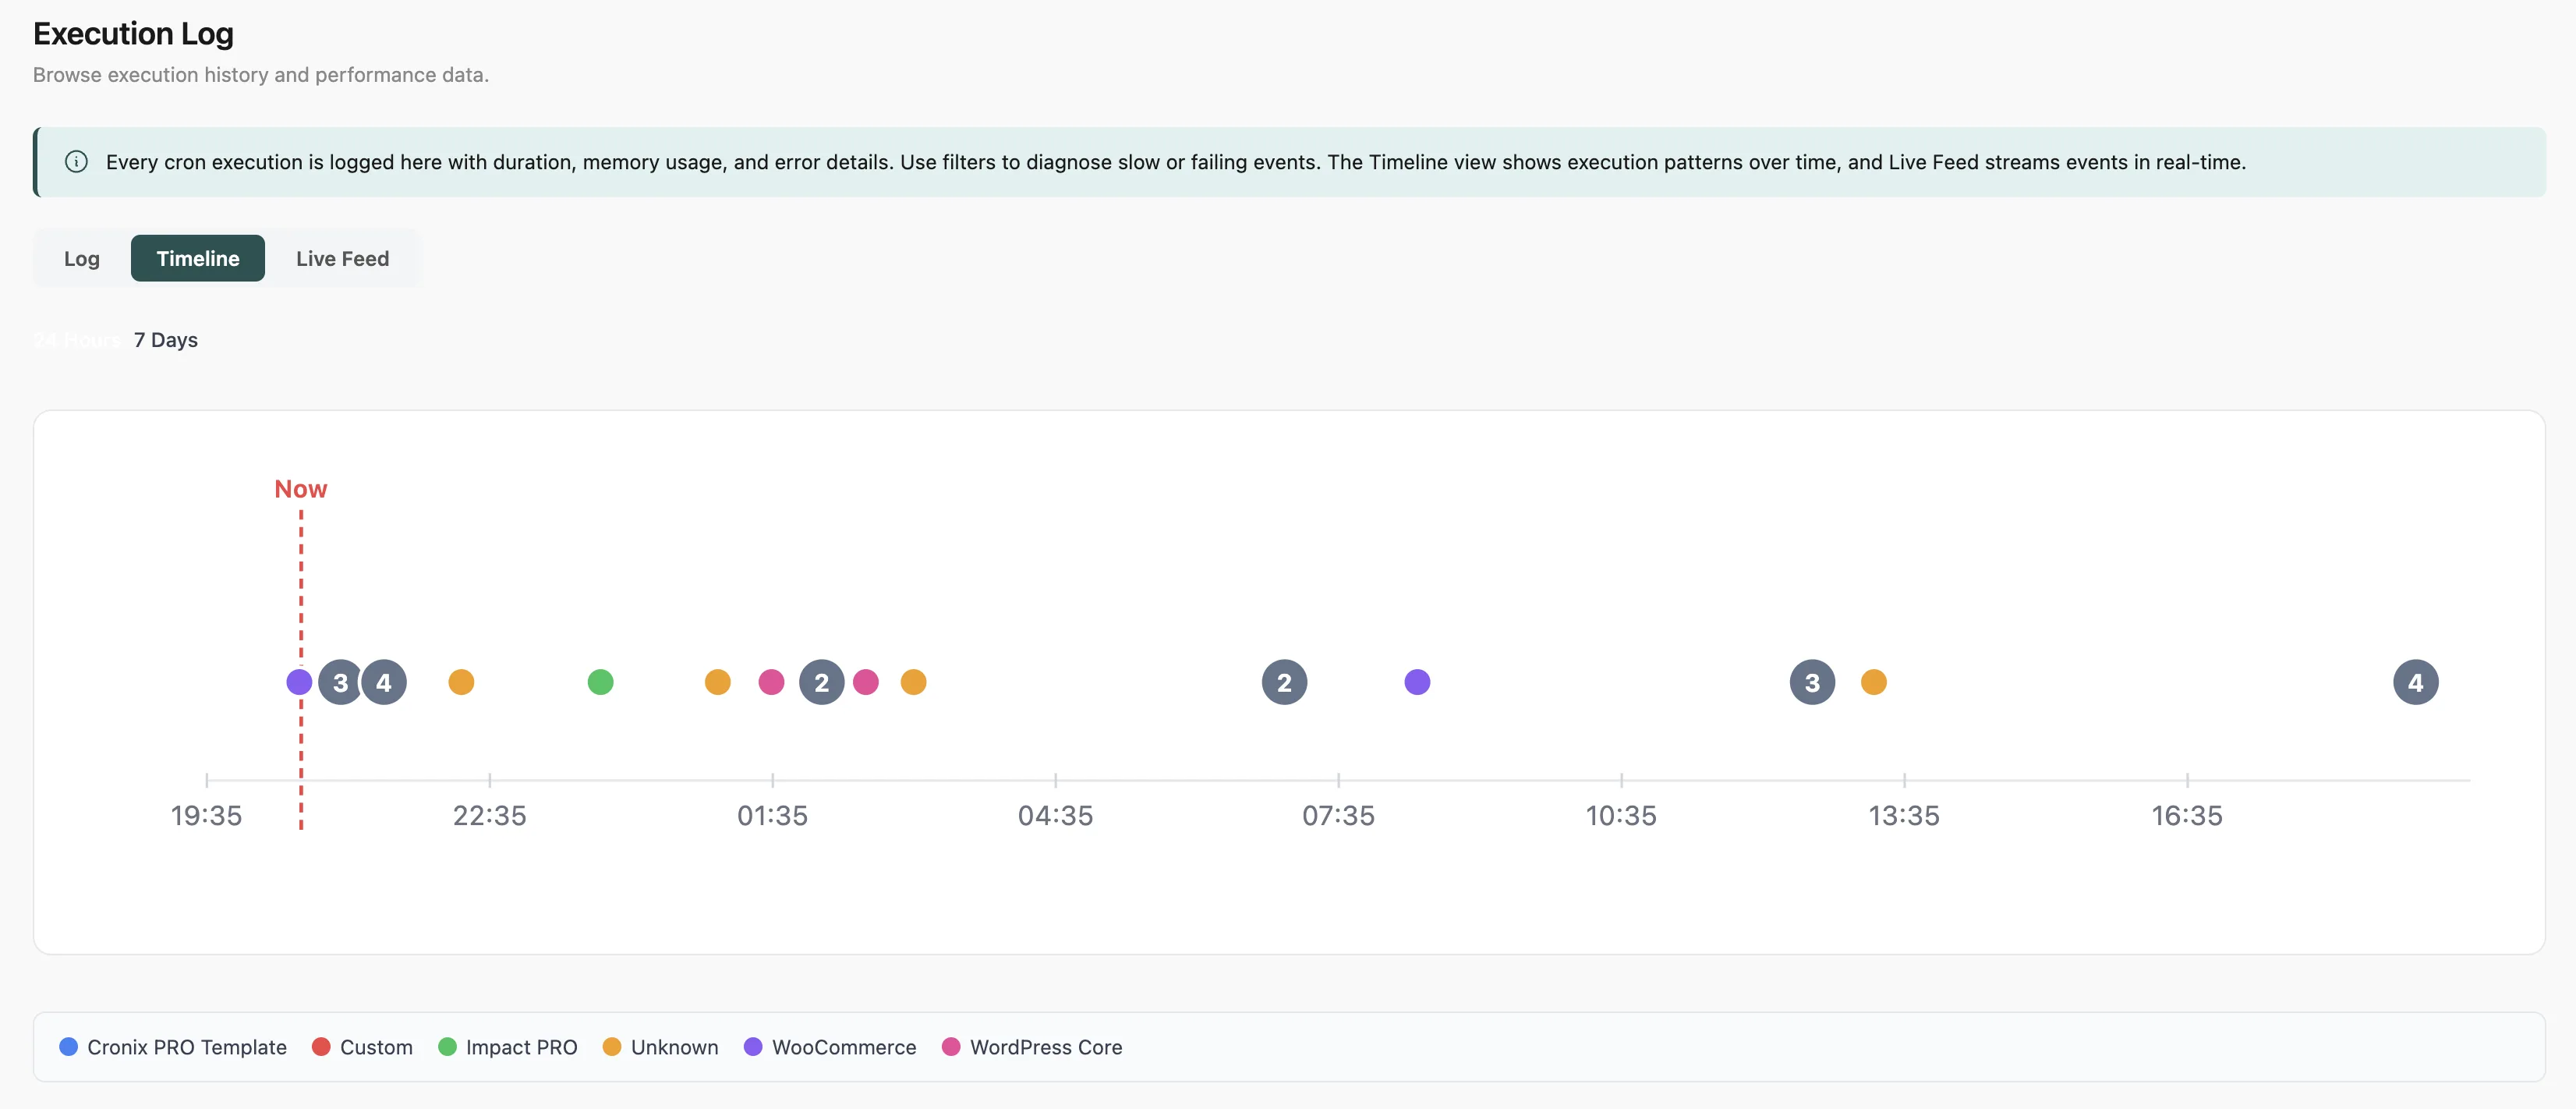
A graphical view of when your cron events are scheduled to fire. Instead of reading timestamps in a table, you see your entire schedule laid out visually - making gaps, clusters, and collisions immediately obvious.
#Views
- 24-hour - shows today's full schedule on a single horizontal axis. The "now" marker moves in real time so you can see what is upcoming.
- 7-day - shows the week ahead with events grouped by day. Good for spotting which days are resource-heavy.
- Month - a calendar grid view showing event density per day.
The 24-hour view is the most useful for diagnosing cron pile-ups - moments when many events are scheduled at the same time and compete for resources.
#Event Dots
Each dot on the timeline represents one event. Dots are color-coded by source plugin, so you can instantly see which plugins are scheduling the most activity.
Hover over a dot to see:
- Hook name
- Source plugin
- Scheduled time
- Recurrence interval
Click a dot to open the full event detail panel.
#Cluster Warnings
When multiple events are scheduled within a short window (configurable, default: 30 seconds of each other), the timeline highlights the cluster with a warning indicator.
Cron clusters are not always a problem, but on shared hosting they can cause timeouts when too many PHP processes run simultaneously. The timeline makes them visible so you can decide whether to stagger them.
#Filtering
- Filter by source plugin to focus on the schedule of one plugin
- Toggle one-time events on or off
- Toggle paused events on or off
Last updated
Was this article helpful?

On this page