Execution Log
A chronological record of every cron execution on your site. This is where you go when something breaks - or when you want to prove everything is running smoothly.
The Execution Log requires Execution Tracking to be enabled in Settings > General. Without it, no data is collected.
#Aggregate Stats
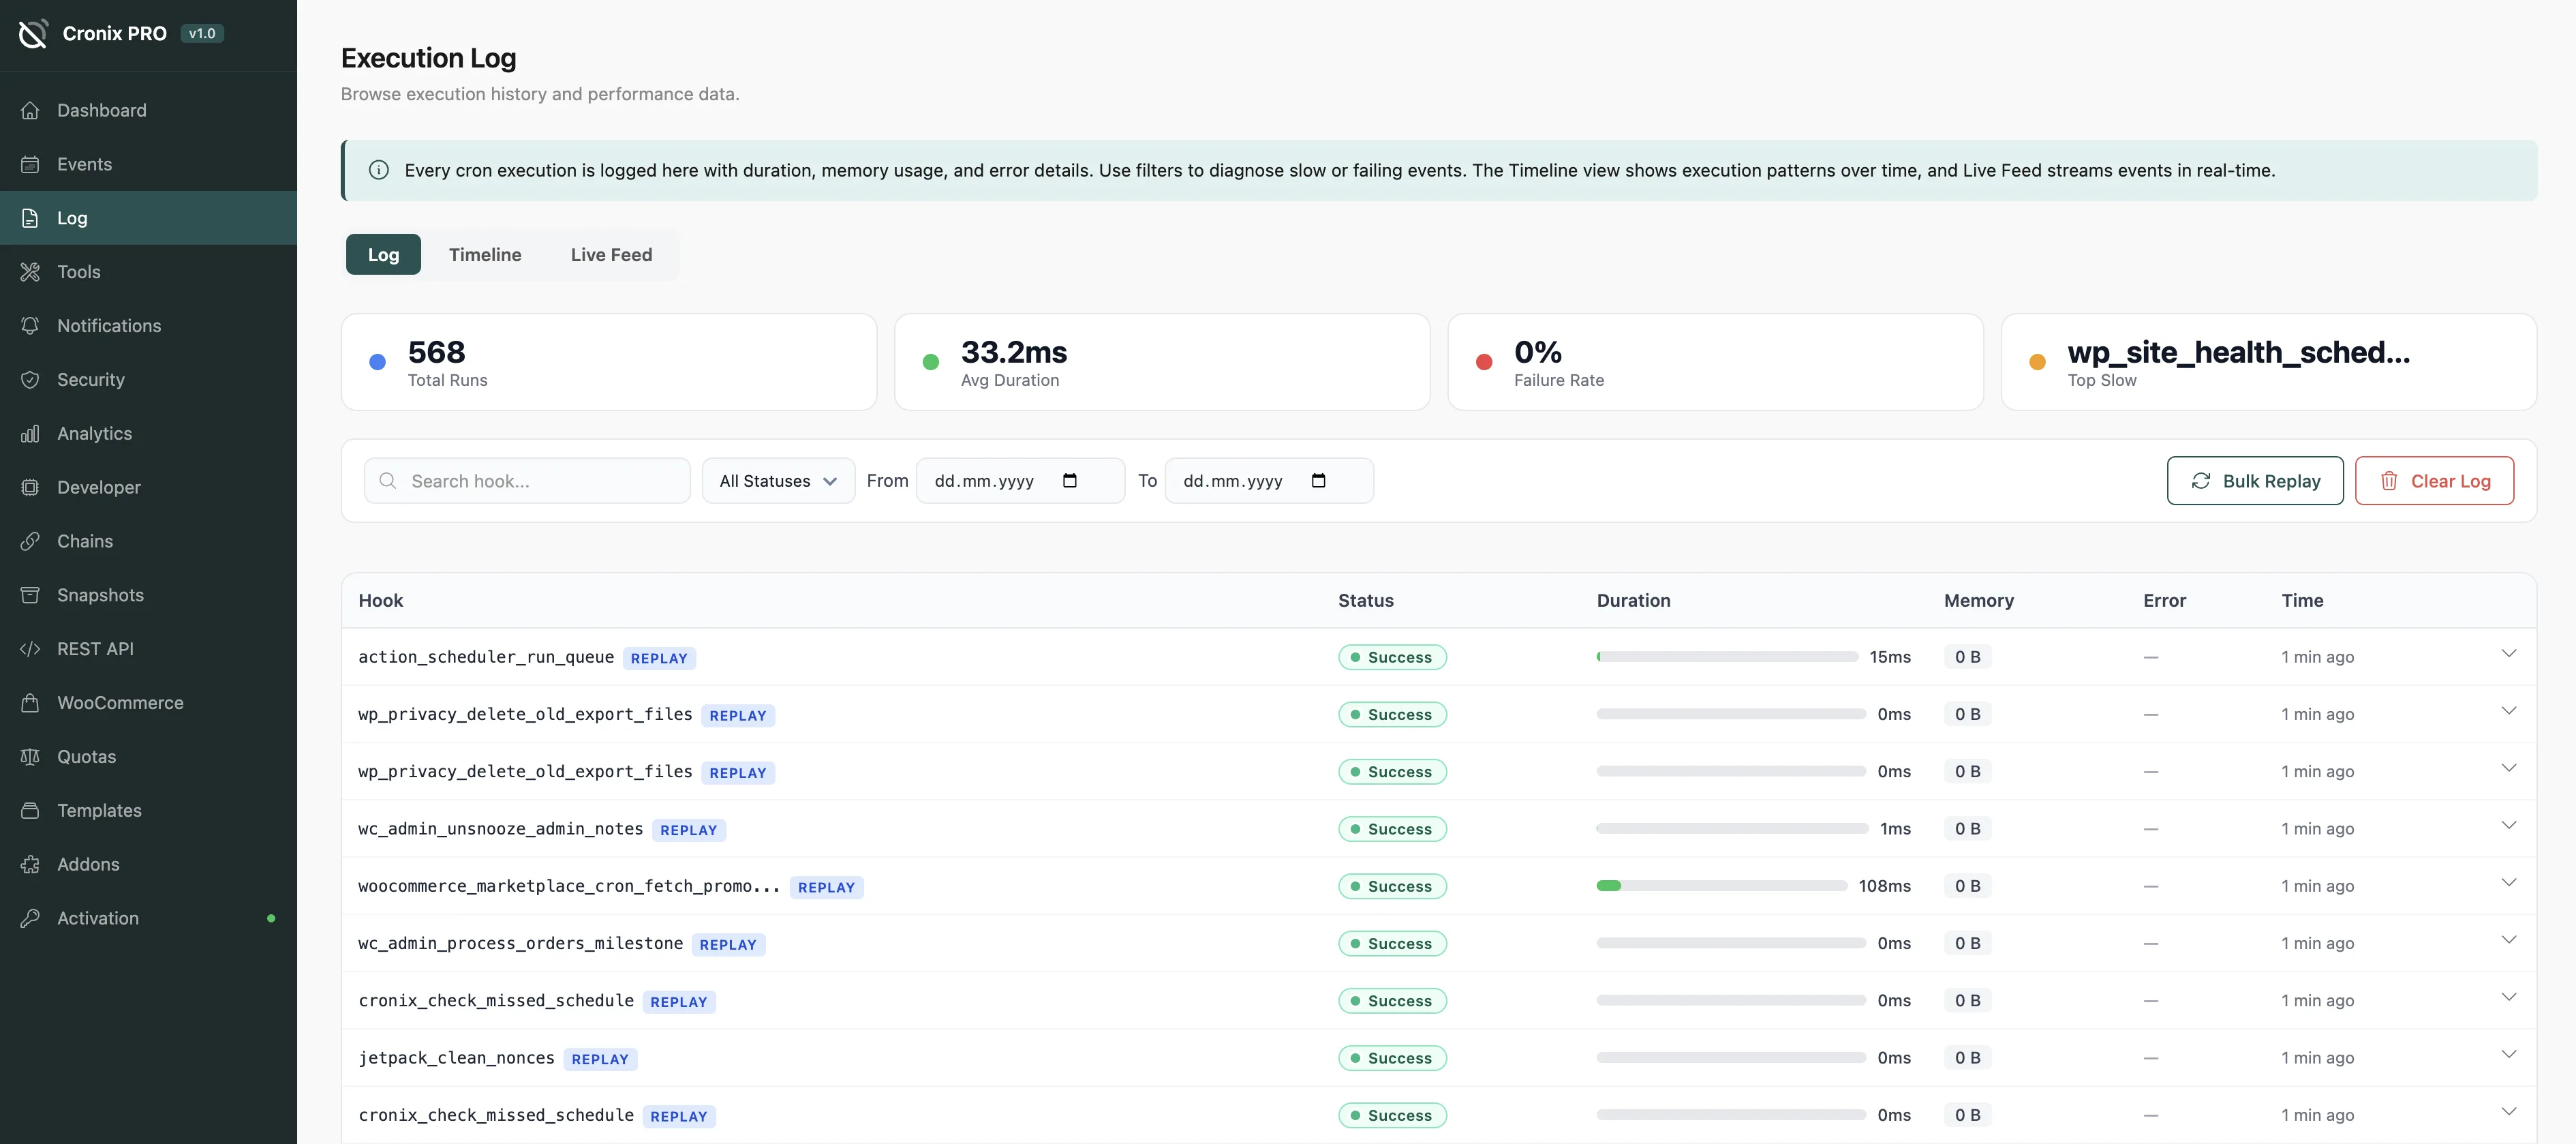
Above the table, four summary cards show the totals for the selected time period:
Total Runs - how many executions fired
Average Duration - mean execution time in milliseconds
Failure Rate - percentage of runs that errored
Slowest Hook - the hook with the highest single execution time
#Log Table Columns
Column | Description |
|---|---|
Hook | The cron hook name |
Status | Success, Error, or Timeout |
Duration | Execution time shown as a colored progress bar |
Memory | Peak memory usage shown as a badge |
Timestamp | When the event fired |
The duration bar is color-coded: green under 1 second, yellow between 1-5 seconds, red over 5 seconds.
A long string of yellow or red bars for a single hook is a clear signal it is worth profiling. Check the Analytics addon for trend data over time.
#Error Details
Click any row with an Error status to expand the full error message and PHP stack trace. This makes it easy to pinpoint exactly which line of code caused the failure.
#Filters
Hook name - search by partial match
Status - Success, Error, Timeout, or All
Date range - from/to date picker
#Live Feed
Switch to Live Feed mode to watch executions stream in real time. Each new entry appears at the top as it is recorded. Useful when testing or debugging a specific hook.
#Clear Log
Use the Clear button to delete all log entries, or filter first and clear only the matching date range.
Clearing the log is permanent. Consider exporting a CSV first if you need to keep a record for auditing purposes.
Last updated
Was this article helpful?

On this page