
Dashboard Overview
The Dashboard is the first page you see after activation. It gives you an immediate read on the health of your cron schedule - no digging required.
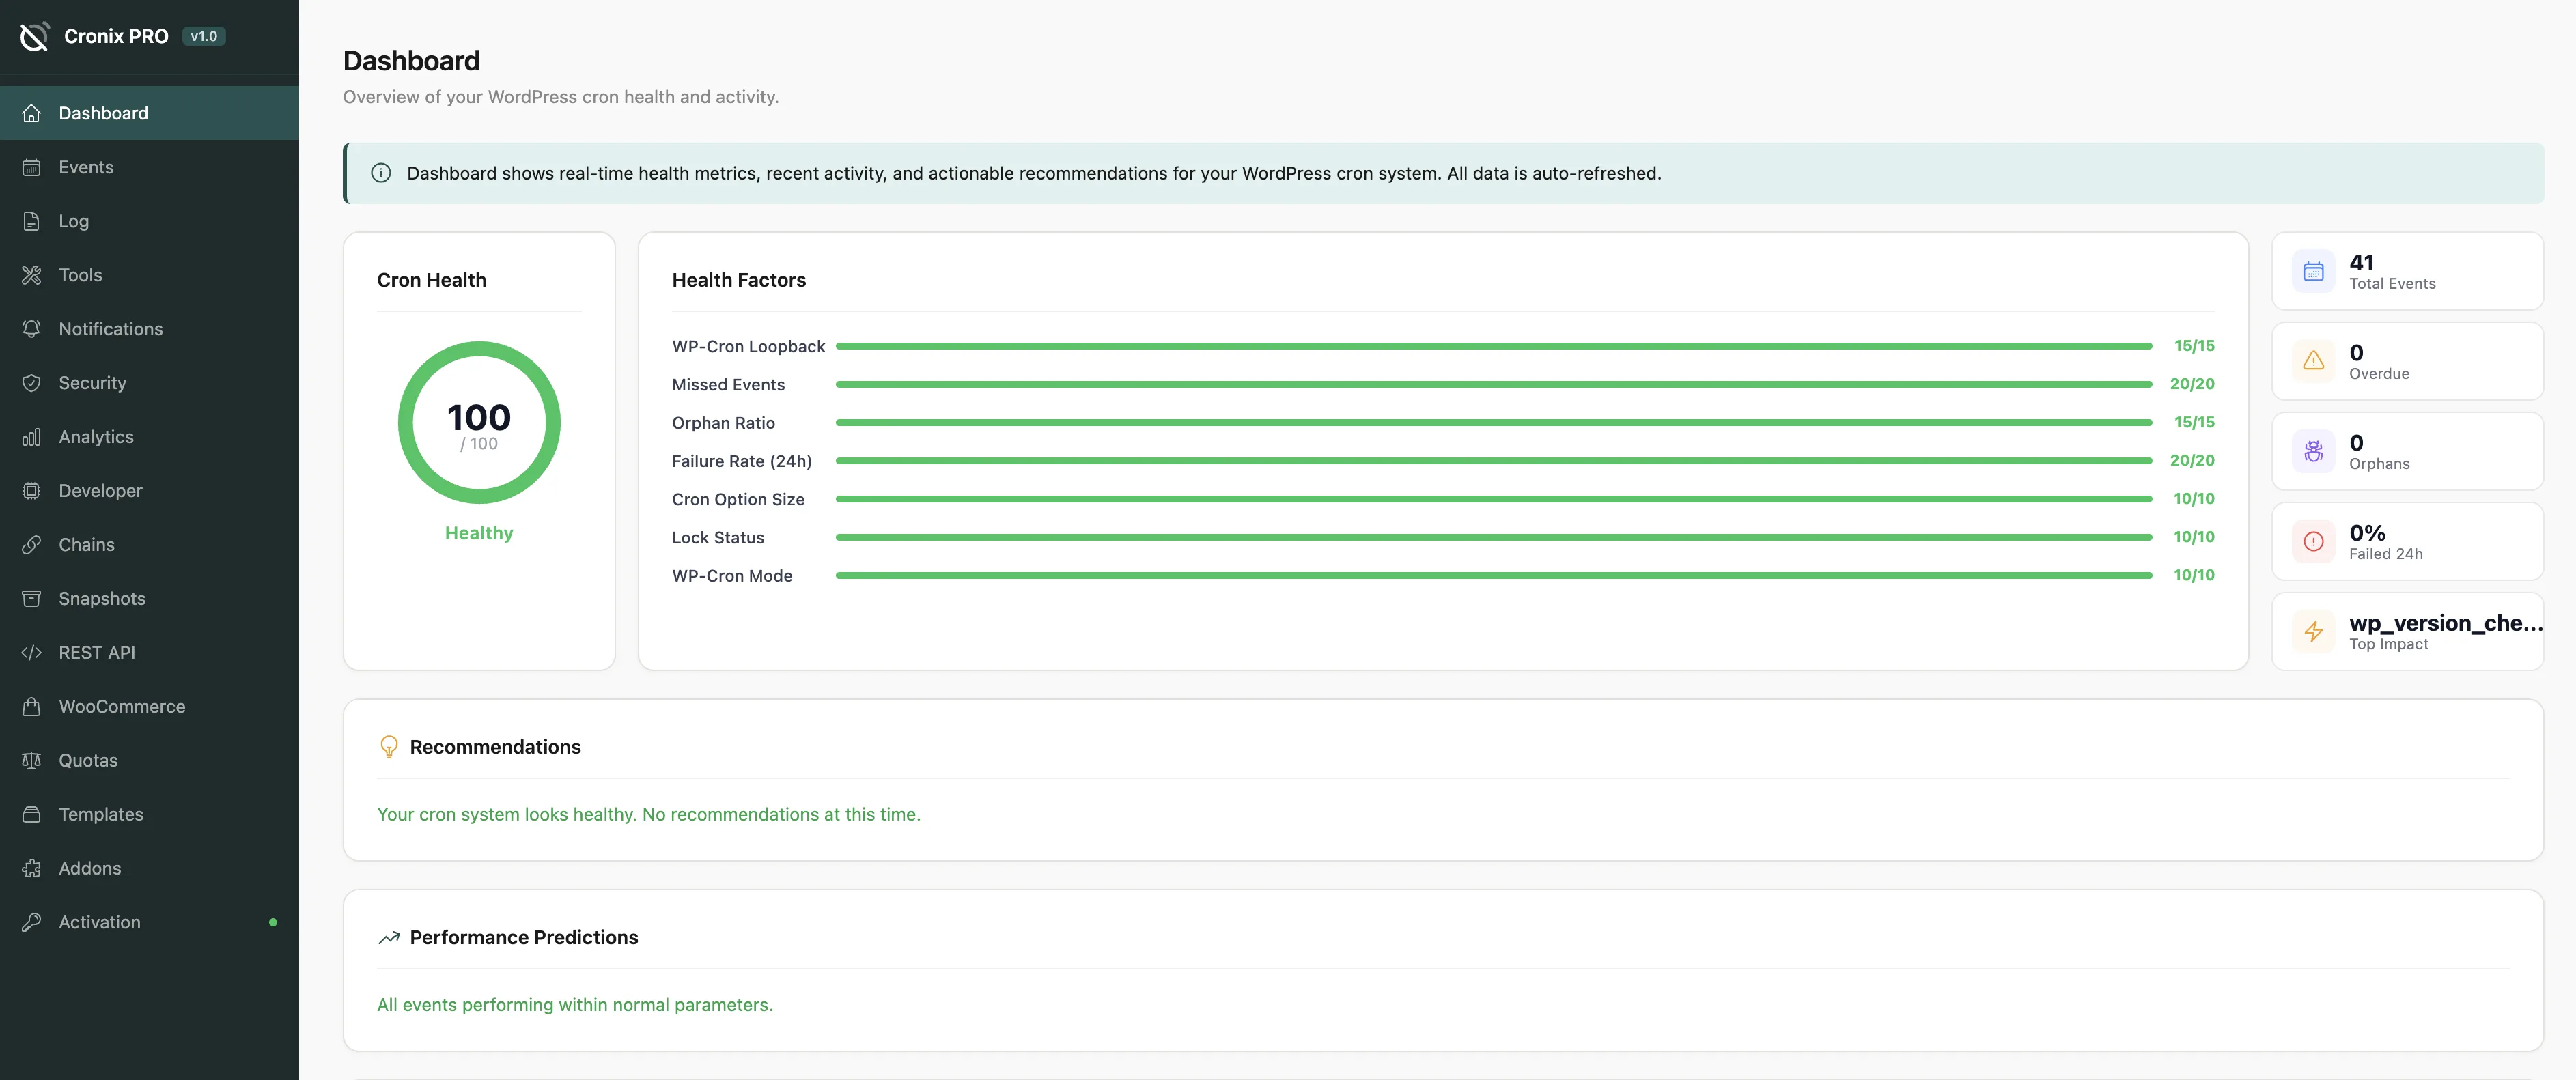
#Health Score
The large donut chart in the top-left shows a score from 0 to 100. It is calculated from six weighted factors:
Factor | What it checks |
|---|---|
Failure Rate | Percentage of recent executions that errored |
Schedule Lag | How far overdue events are running |
Orphan Count | Hooks with no registered callback |
Duplicate Events | Same hook scheduled more than once |
Loopback Health | Whether wp-cron.php is reachable |
Server Cron | Whether a real cron job is configured |
100 is a perfect schedule. Scores below 70 indicate issues worth investigating.
Click the health score donut to jump directly to the factor breakdown and see exactly what is dragging the score down.
#Stat Cards
Four cards below the donut give you a quick snapshot:
Total Events - number of registered cron hooks
Overdue - events that missed their scheduled time
Paused - events you have manually paused
Errors (24h) - failures in the last 24 hours
#Recent Executions
The table at the bottom shows the last 10 executions with hook name, status, and duration. Click any row to open the full log entry.
The dashboard auto-refreshes every 60 seconds. You can also click the refresh icon in the top-right corner to update immediately.
Last updated
Was this article helpful?

On this page